Dashboard
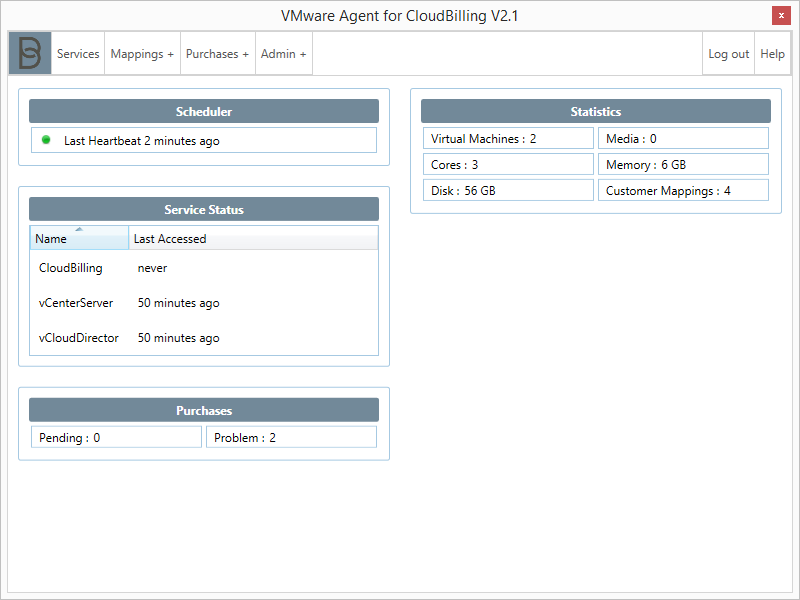
The dashboard is the home page of the VMware Agent application (see figure 1). It shows a quick overview of the following status and statistics:
-
VMware Agent Scheduler
This section indicates when the VMware Agent last received a signal from the scheduling service. -
Service Status
This section indicates how long ago each service has been accessed. To change the sorting options, click “Name” for sorting on Service name from A-Z, click again for sorting on Service name from Z-A, or click “Last Accessed” for sorting on Service last accessed from most recent to least recent, click again for sorting on Service last accessed from least recent to most recent. -
Purchases
This section shows how many purchases are pending to be sent to CloudBilling and how many purchases have encountered a problem that needs to be resolved before it can be sent through. -
Stats
This section gives an overview of the total usage of cores, disk and memory by the virtual machines that are discovered by the agent, as well as the total number of media files in vCloud Director. It also shows the total number of customer mappings.